Dashboard
The main page of the software which shows graphs and charts about the livestock. You can change the shown values manually as you like.
Setup takes place during implementation and can be modified later. You are able to decide which graphs and statistics will be on display.
In addition to this, personal needs can be satisfied in case of agreement.
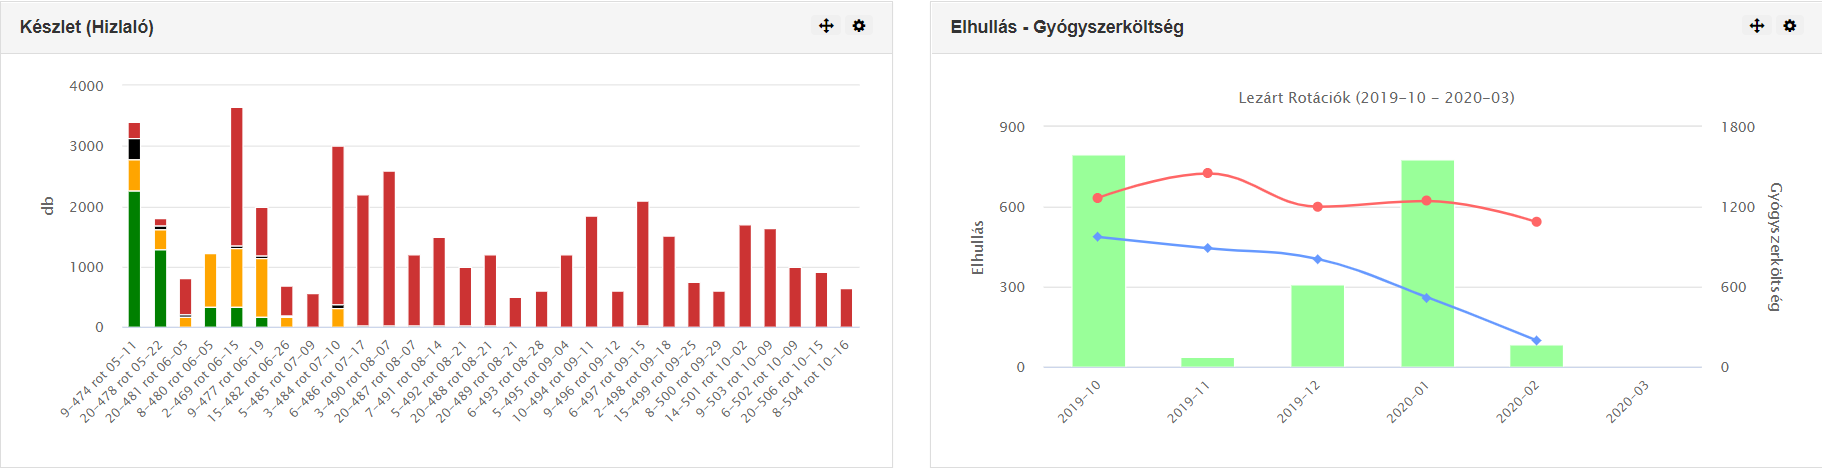
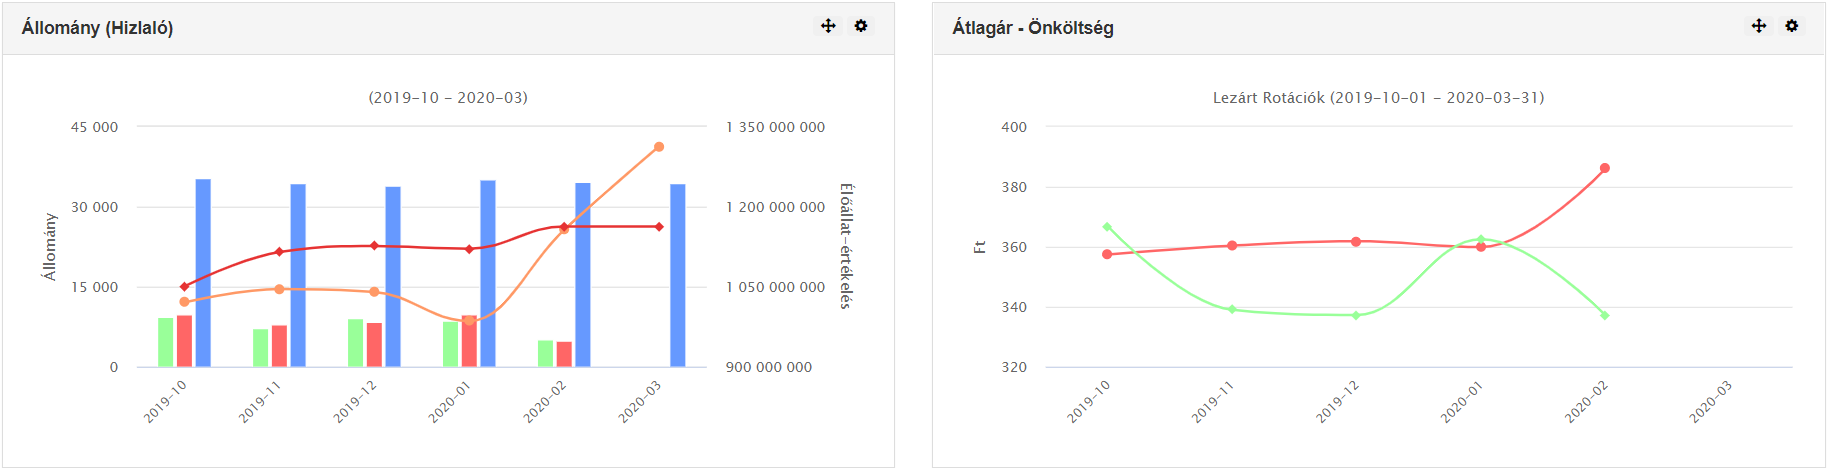
Graphs can be shown on different time scale and you can choose the farm and the genetics from which the software present the values on it.
This way you can see the liabilities, the product price, the revenue (and profit) per customer as well as your stock, your rotations, the mortalities, sold pieces etc.
What is more you can set any combination of those to be shown on the dashboard.
Setup takes place during implementation and can be modified later. You are able to decide which graphs and statistics will be on display.
In addition to this, personal needs can be satisfied in case of agreement.
Graphs can be shown on different time scale and you can choose the farm and the genetics from which the software present the values on it.
This way you can see the liabilities, the product price, the revenue (and profit) per customer as well as your stock, your rotations, the mortalities, sold pieces etc.
What is more you can set any combination of those to be shown on the dashboard.
Afbeelding
Afbeelding